
Here’s a rundown of all the information we show you for every stock in our instrument pool, and how to make sense of it 👇
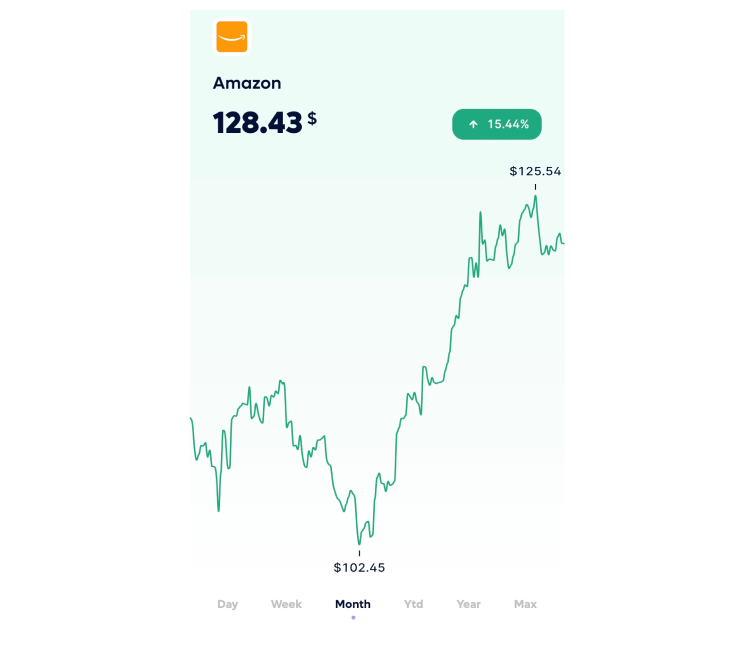
Current & historical stock price
This is a graph of a stock's price and its percentage change for your chosen time period. Just click on the graph and drag through it horizontally to see the stock price at a specific time or date.
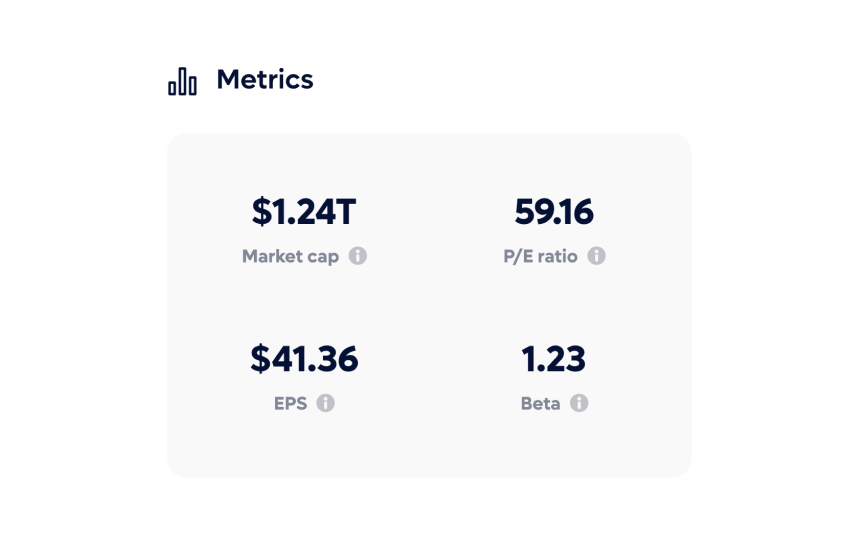
Metrics
Under metrics, we’ll show you a variety of data you can use to decide if a stock is in a desired enough position for you to buy. Here are the numbers broken down:
Market cap
Short for market capitalisation, the market cap refers to how much the company is worth and is one of the best measures of the company’s size. It’s calculated by multiplying the share price with the number of shares outstanding.
EPS
Earnings per share is a metric used by investors to value a stock or company, because it indicates how profitable a company is on a per-share basis.
In the Lightyear app, we use trailing 12 months EPS, which is calculated by subtracting any preferred dividends from a company’s net income from the last 12 months and dividing that amount by the number of shares outstanding.
P/E ratio
This measures the relationship between a company’s stock price and its earning per issued share. The P/E ratio is often used as a quick way to learn whether a company is over or undervalued, relative to the company’s growth prospects or against peers.
The P/E ratio is calculated by dividing a company’s current stock price by its trailing 12 month earnings per share (EPS)
Beta
A metric that compares a stock’s price movement relative to the overall market index. We use the S&P 500 index for our calculations.
Beta is useful to understand how volatile a stock’s price is. If the value is above 1, it indicates that the stock’s price moves are more volatile than the market index. If it's below one, the stock is less volatile than the market.
To illustrate, a beta of 0.5 implies that a stock’s movements will theoretically be about 50% of the index’s movements. A beta of 2 implies the stock will move twice as much as the market.
Dividend rate
The amount of cash an investor can expect to receive on an annual basis for holding 1 share in a company, assuming the dividend remains the same.
Dividends, set by the company’s board, are the distribution of some of the company’s earnings to its shareholders as a reward for putting their money into the company.
Dividend yield
A stock’s annual dividend payments (dividend rate) to shareholders, expressed as a percentage of the stock’s current price.
This numbers tells you what you can expect in future income from a stock based on the price you could buy it for today, assuming the dividend remains unchanged.
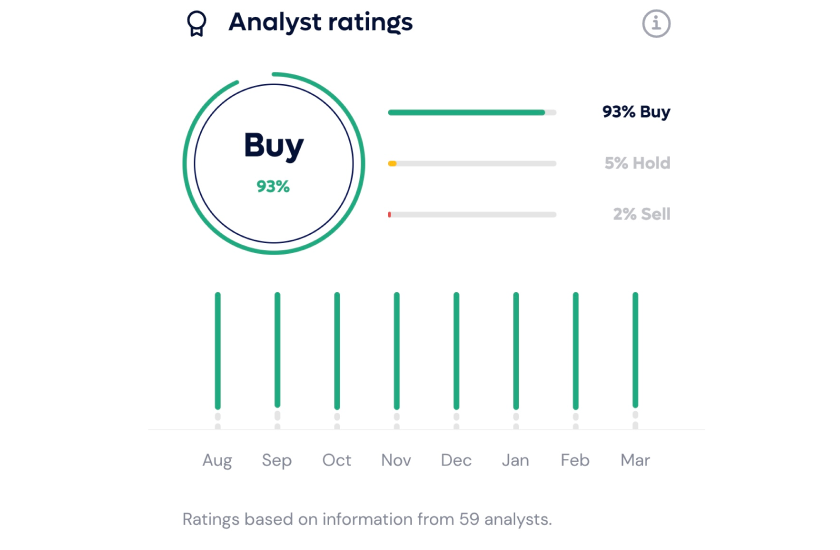
Analyst ratings
Analyst ratings sum up the sentiment of a stock by aggregating the buy, hold and sell recommendations that are put out by Wall Street analysts. These ratings are opinions on the stock’s future performance based on independent analysis on the company’s financials — like sales, profit, debt and growth.
These ratings shouldn’t be seen as investment advice, but they are a useful data point as part of carrying out your own in depth research when making investment decisions. We’ve also made the historic ratings available to you, so you’re able to see how sentiment for this stock has changed over time.
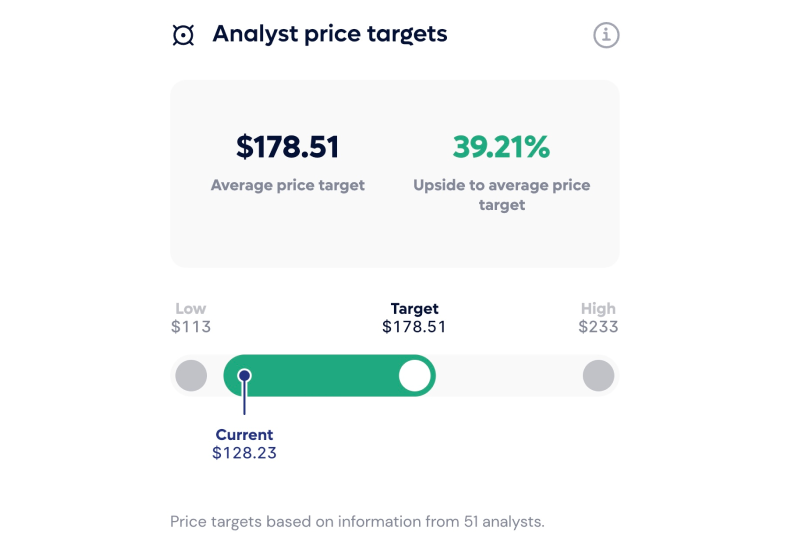
Analyst price targets
Price targets are analysts’ projection of a stock’s future price. When setting a stock’s price target, an analyst looks at a number of factors, including the financial health of the company, management, earnings releases, sector trends, and more.
Analysts use this information to determine what the stock is worth and what the price will be in 12 or 18 months.
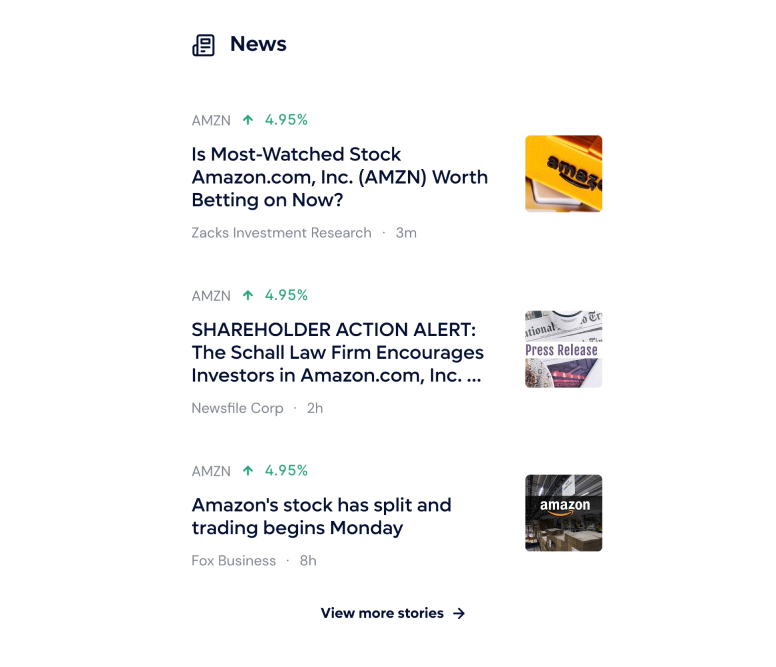
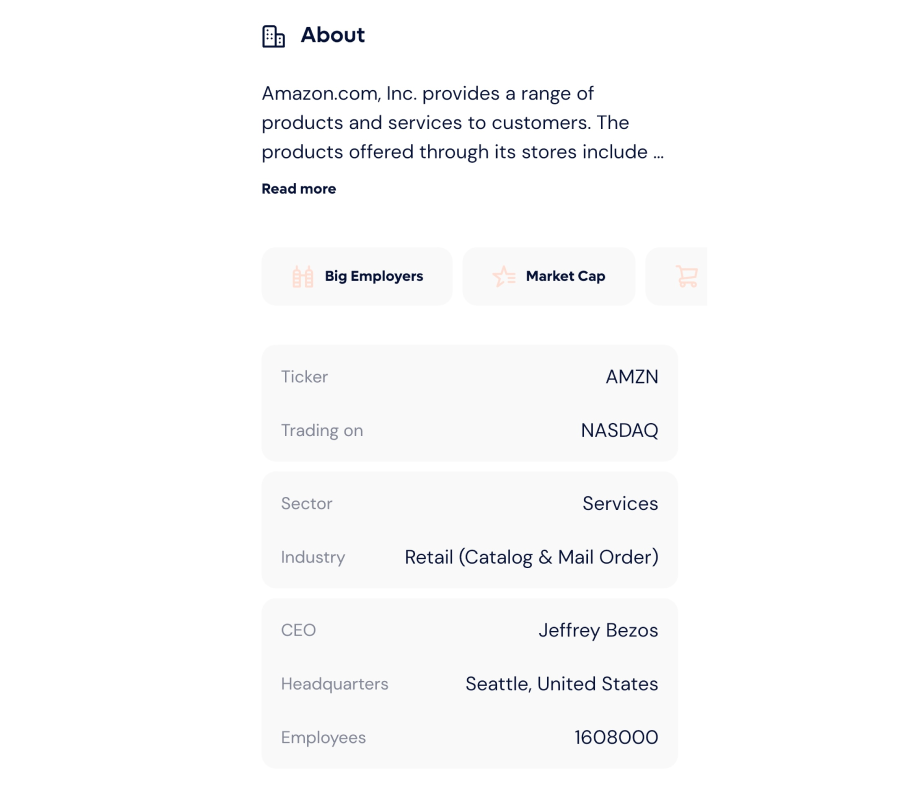
News & about
On every stock’s page, you’ll also find the latest news about the company and its stock, pulled from various sources — for example, Yahoo Finance, Business Insider, and many more.
And to finish it off, every stock’s page includes a description of the company and headline information; ticker symbol, where it’s listed, sector, CEO & headquarters.
So, forget about rummaging through tons of different websites and apps to do your research before investing. In the Lightyear app you’ll find all this information broken down for 3000+ stocks, ready for you to get learning.
Understanding the jargon has never been this easy!
———————————————————————————————————————————————
Keep in mind that this blog post, or any of the data you see in the app, shouldn’t be taken as investment advice. It’s meant to be used as a resource to help you carry out your research before investing. The definitions used in this blog post are taken from the Lightyear app, written by our product teams. When investing, your capital is at risk.
The photos used in this blog are illustrative, taken from the Amazon stock page on June 6th.
Joachim Seminck is a full-stack product engineer at Lightyear. A veteran of Pipedrive, Joachim was one of the first engineers at Lightyear and is responsible for some of the technical foundations of our product. Outside of work, Joachim is an experienced investor and an avid cyclist.


